
Benchmark Scores are your quick ‘go to’ global score for any city.
These Benchmark scores are available in Indicators and the City Scorecard product.
Only 2thinknow indicators contain benchmark scores as convenient ‘go to’ metric in any meeting or analysis.
All indicators contain benchmark scores standardized across all cities.
Did you know? Across cities the same benchmark scores indicate a comparable quality of outcome across cultural and economic difference. Cities in the same band are competing at a similar level.
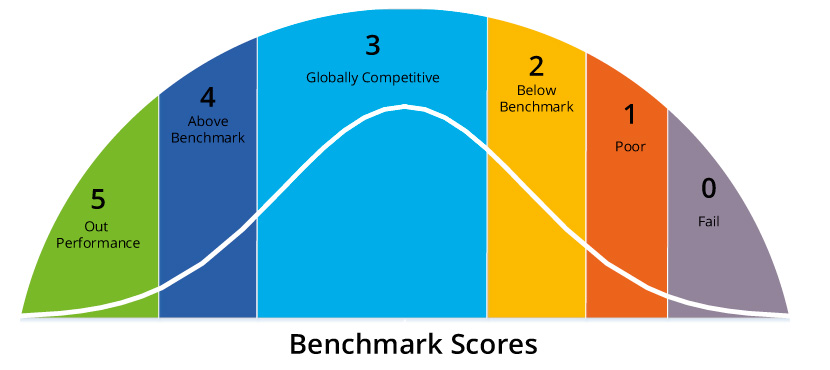
Bell Curve Standarized
The indicator follows a bell curve distribution across our data-set. This looks like most globally developed cities fighting it out in the middle as a globally competitive 3. This also means a 5 is a very difficult score to receive.
The following is a sample of the current distribution of cities for an indicator:
Benchmark Score |
Benchmark Scoring Assessment Guide |
Index New Qual |
No. of Cities |
| BM 5 | Out-performance | 2500 | 12 |
| BM 4 | Above Benchmark | 2200 | 68 |
| BM 3 | Globally Competitive | 500 | 236 |
| BM 2 | Below Benchmark | 350 | 103 |
| BM 1 | Fair/ Poor | 100 | 28 |
| BM 0 | None/ Failure | 0 | 7 |
*Note the distribution is based on 454 cities, not 450.
Standardized
Benchmark scores are fully standardized across all cities in the data-set. Even If you buy only 10 cities, the Benchmark scores for those cities are standardized across 450 cities.
Benefits of 2thinknow Indicators with Benchmark Scores
- Easily compare relative performance of your selected cities to 450 cities, even if you only order 10.
- Enable business to identify and compare opportunities in key market sectors in cities worldwide.
- Go-to Metric: Benchmarking scores give a clear comparative measure in a meeting or conference.
- Sourced: Underlying data sources are examined, analysed and the best available evidence used.
- Standardized benchmarking methodology keeps the scores consistent and comparable across cultures and locations.